> For the complete documentation index, see [llms.txt](https://docs.docbits.com/llms.txt). Markdown versions of documentation pages are available by appending `.md` to page URLs; this page is available as [Markdown](https://docs.docbits.com/chinese/guan-li-yu-she-zhi/settings/log-settings/analytics.md).
# 分析
使用选项卡和筛选器,缩小要检查的指标范围。
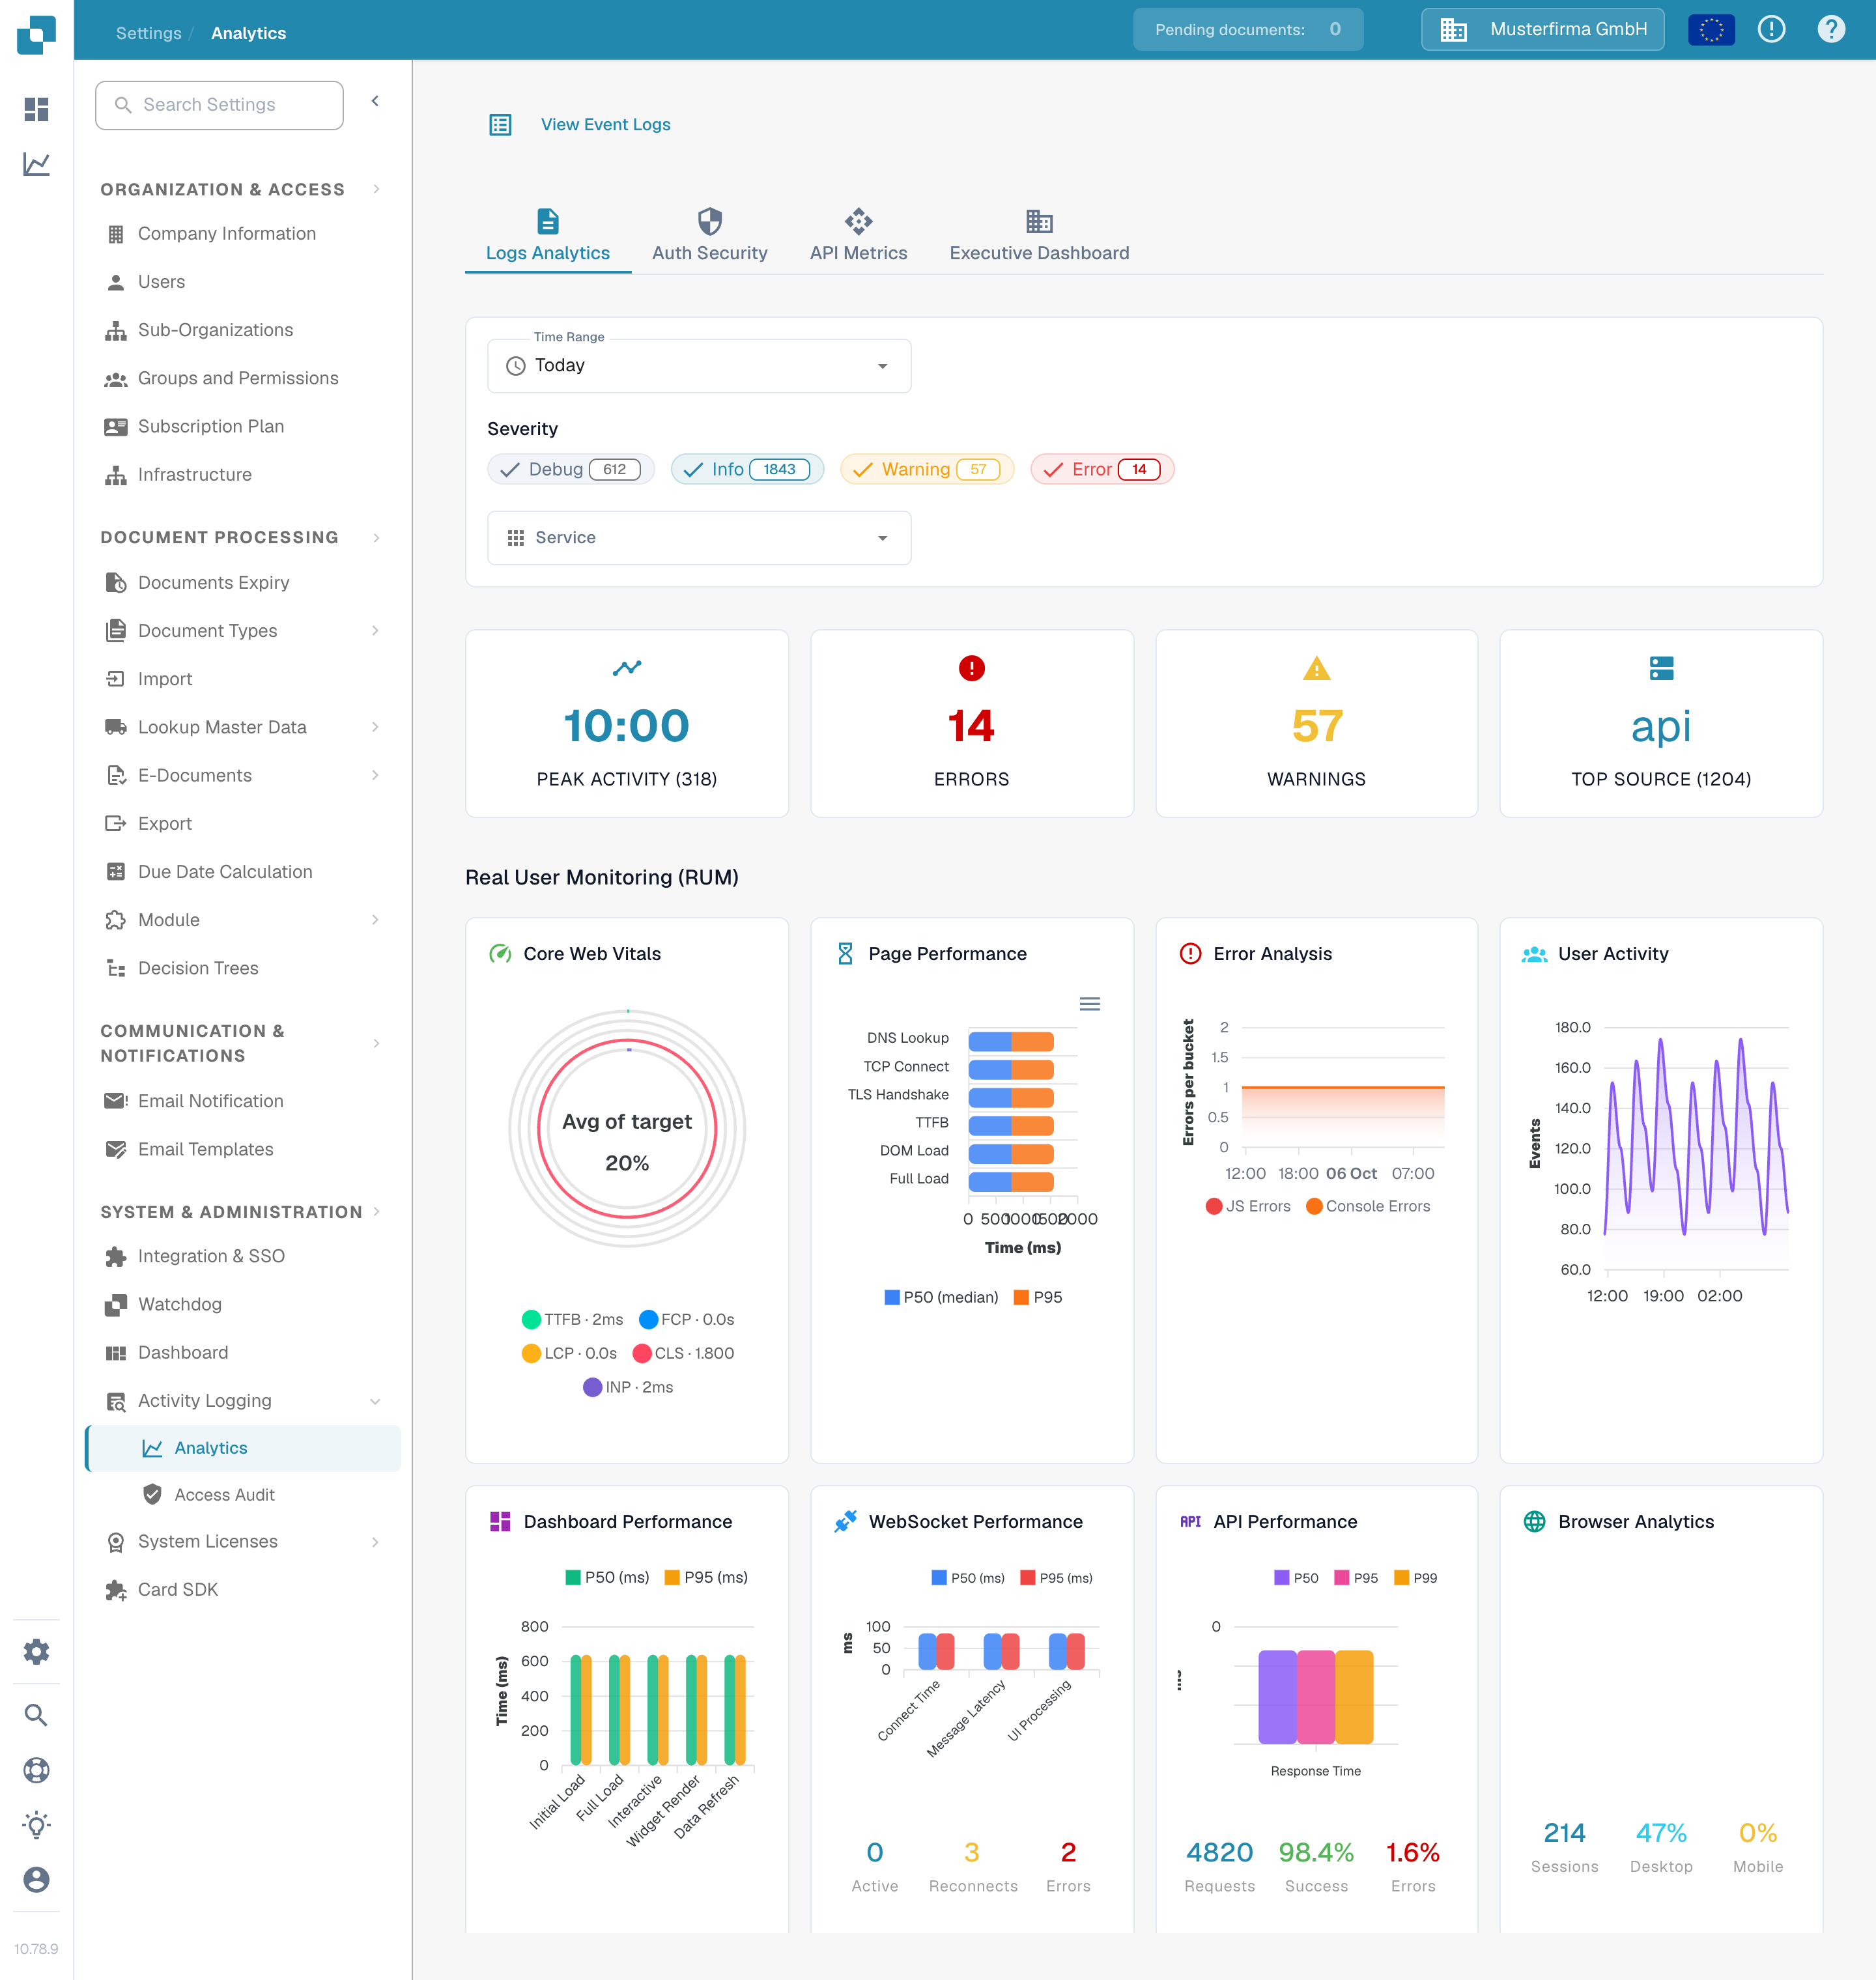
“分析”页面可帮助您检查日志模式、身份验证事件、API 使用情况和高层概览。请先查看 **Logs Analytics**。需要调查某条具体记录时,选择 **View Event Logs** 打开底层事件列表。
## 选项卡
| 选项卡 | 说明 |
| ----------------------- | --------------------------- |
| **Logs Analytics** | 日志严重性分布、时间线图表和服务细分。 |
| **Auth Security** | 身份验证事件、登录尝试和安全相关指标。 |
| **API Metrics** | API 请求量、响应时间和错误率。 |
| **Executive Dashboard** | 面向组织管理员的高层概览;其他角色可能看不到此选项卡。 |
## 筛选器
| 筛选器 | 说明 |
| -------------- | ------------------------------------------------------- |
| **Time Range** | 选择指标的时间范围(例如 Today、Last 7 Days)。 |
| **Severity** | 点击 Debug、Info、Warning 或 Error,以包含或排除相应级别。筛选项上的数字表示当前数量。 |
| **Service** | 选择要检查其事件的服务。 |
## 汇总卡片
筛选器下方会显示四张汇总卡片:
| 卡片 | 说明 |
| ----------------- | -------------- |
| **Peak Activity** | 日志量最高的时段及其总数。 |
| **Errors** | 所选时段内的错误总数。 |
| **Warnings** | 所选时段内的警告总数。 |
| **Top Source** | 产生日志最多的服务及其数量。 |
## 真实用户监控(RUM)
汇总卡片下方的 RUM 指标显示从真实用户浏览器会话中收集的前端性能数据。
## 分析图表
在 **Logs Analytics** 中,选择三个图表按钮之一,以更改相同筛选后日志的显示方式:
| 视图 | 说明 |
| ------------ | -------------------------------------- |
| **Severity** | 饼图,显示日志级别分布(Debug、Info、Warning、Error)。 |
| **Timeline** | 折线图,显示一段时间内的日志量。 |
| **Service** | 条形图,按服务细分日志。 |
如果图表显示没有可用数据,请尝试扩大 **Time Range** 范围或减少 **Severity** 筛选条件。截图中的数据属于合成 Sandbox 组织,您所在组织的数据会有所不同。
---
# Agent Instructions
This documentation is published with GitBook. GitBook is the documentation platform designed so that both humans and AI agents can read, navigate, and reason over technical content effectively. Learn more at gitbook.com.
## Querying This Documentation
If you need additional information that is not directly available in this page, you can query the documentation by asking a question.
Perform an HTTP GET request on the following URL with the `ask` and `goal` query parameters:
```
GET https://docs.docbits.com/chinese/guan-li-yu-she-zhi/settings/log-settings/analytics.md?ask=&goal=
```
`ask` is the immediate question: it should be specific, self-contained, and written in natural language.
`goal` is what the user is ultimately trying to achieve, the reason they need the answer. Sharing it helps GitBook give you a better, more relevant answer. A goal is most helpful when it describes the outcome the user wants rather than restating the question. For example, with `ask=how do I create an API token`, a goal like `automate deployments from our CI pipeline` lets GitBook tailor the answer to that use case.
The response will contain a direct answer to the question and relevant excerpts and sources from the documentation.
Use this mechanism when the answer is not explicitly present in the current page, you need clarification or additional context, or you want to retrieve related documentation sections.