> For the complete documentation index, see [llms.txt](https://docs.docbits.com/llms.txt). Markdown versions of documentation pages are available by appending `.md` to page URLs; this page is available as [Markdown](https://docs.docbits.com/chinese/guan-li-yu-she-zhi/settings/infrastructure.md).

# 基础设施

**基础设施**页面为管理员提供 DocBits 各个部分运行位置（EU 或 US）、文档在系统中的流转方式，以及后台处理运行状况的实时概览。此页面为只读页面——这里不进行任何配置；它用于回答\*“一切是否都在运行，我的数据是否留在所在区域？”\*

> \*\*访问权限：\*\*基础设施页面仅供管理员访问。打开 **设置 → 组织与访问权限 → 基础设施**。

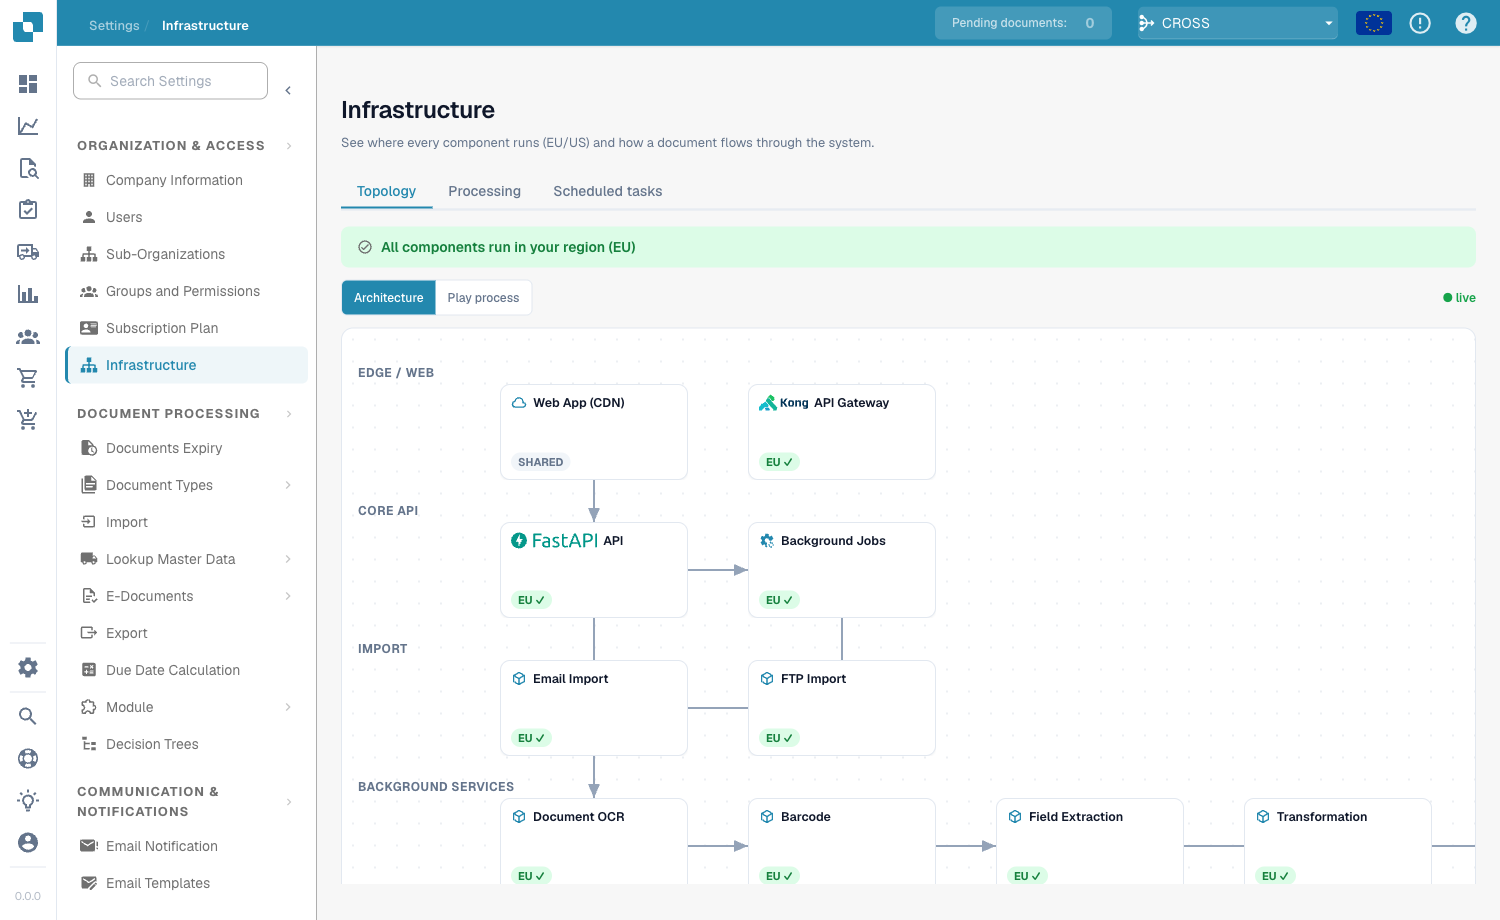
<figure><img src="https://1870485400-files.gitbook.io/~/files/v0/b/gitbook-x-prod.appspot.com/o/spaces%2FlPczlNw8zzYNLfjfispX%2Fuploads%2Fgit-blob-c147e91766c155c4d0b445768987b2409fc5276b%2Finfrastructure_overview.png?alt=media" alt="基础设施页面，已打开拓扑选项卡"><figcaption><p>基础设施页面的拓扑选项卡</p></figcaption></figure>

页面分为三个选项卡：

| 选项卡      | 可查看的信息                              |
| -------- | ----------------------------------- |
| **拓扑**   | 各组件在哪里运行？它们是否都在我的区域内？               |
| **处理**   | 文档处理步骤（OCR、提取、采购订单匹配……）是否正常运行并保持最新？ |
| **计划任务** | 周期性后台作业是否按计划运行？                     |

## 拓扑

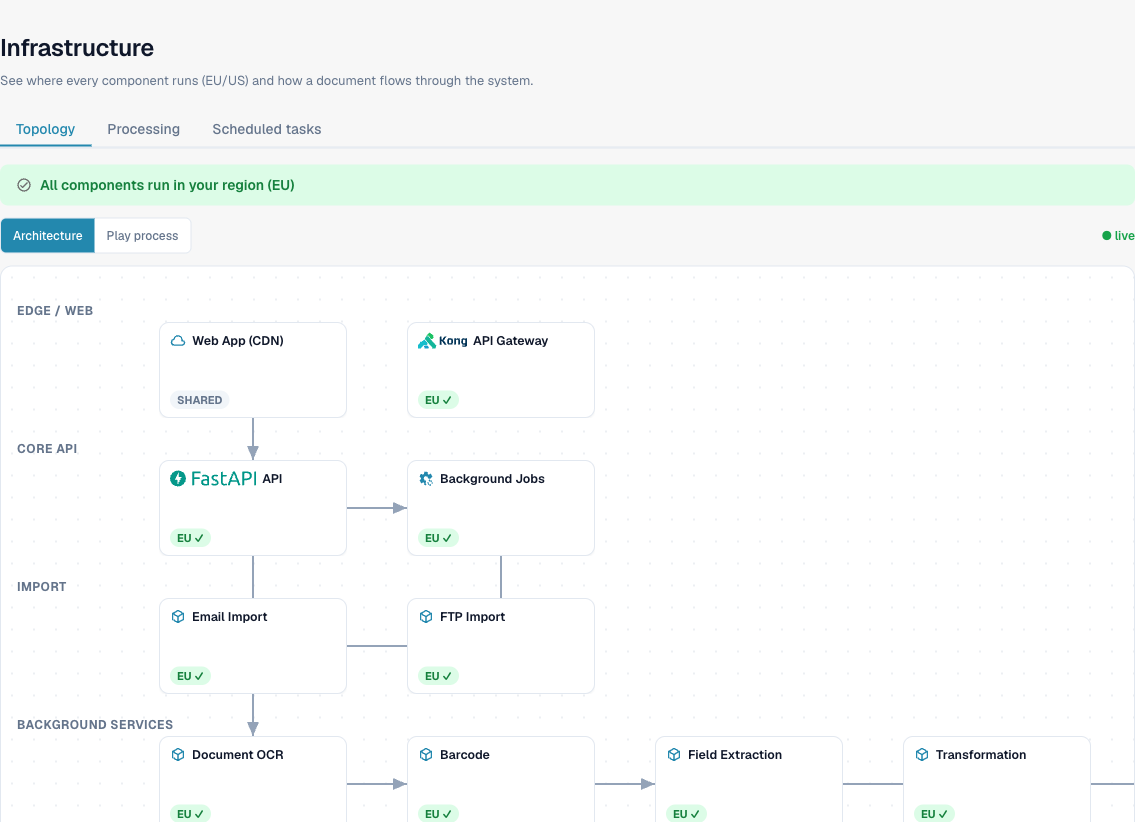
拓扑选项卡以图表展示整个 DocBits 平台，并按层分组——**边缘 / Web**、**核心 API**、**导入**、**后台服务**、**数据存储**和**身份验证**。每个框代表一个组件（Web App/CDN、API Gateway、OCR worker、数据库等）。

<figure><img src="https://1870485400-files.gitbook.io/~/files/v0/b/gitbook-x-prod.appspot.com/o/spaces%2FlPczlNw8zzYNLfjfispX%2Fuploads%2Fgit-blob-1b6e6bbcb2eb2c444ebc1525931a0e39a93e7c53%2Finfrastructure_topology.png?alt=media" alt="带有区域标记的拓扑图"><figcaption><p>每个组件都标记了其运行所在的区域</p></figcaption></figure>

### 区域感知

每个组件都带有区域标记，便于你一目了然地确认数据驻留情况：

| 标记                  | 含义                                      |
| ------------------- | --------------------------------------- |
| **EU ✓** / **US ✓** | 组件运行在你组织所在的区域。                          |
| **SHARED**          | 全局组件（例如 CDN），不属于某个特定区域——这是预期情况，不是问题。    |
| **区域不匹配**           | 组件运行在与你的组织*不同*的区域。系统会突出显示该组件，方便你联系支持团队。 |

页面顶部的横幅会汇总结果：如果所有组件都匹配，则显示 **“所有组件都在你所在的区域 (EU) 运行”**；如果任何关键组件位于其他区域，则显示警告。

### 架构视图与流程演示

使用图表上方的切换控件选择视图：

* **架构** — 展示所有组件及其连接方式的静态图。
* **流程演示** — 逐步动态展示文档在系统中的流转过程，让你查看涉及各组件的先后顺序。

**● live** 指示器表示图表中的运行状况信息反映的是系统当前状态。

### 可选模块

属于可选模块（Full-Text Search、DocFlow、Auto-Accounting、DocNet、PO Matching）的组件会显示**已激活**或**已停用**标记。点击已停用的模块，即可直接前往启用该模块的页面——大多数模块位于 **设置 → 模块**，PO Matching 则位于 **文档类型**（该功能按文档类型启用）。

## 处理

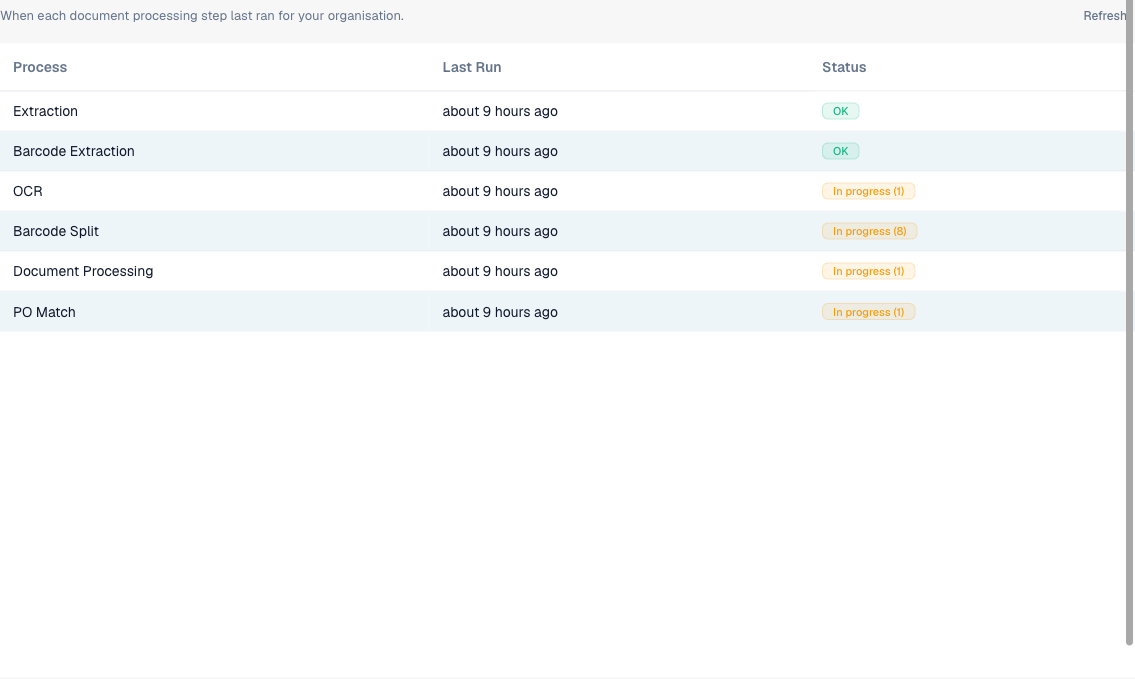
处理选项卡显示**你组织**的文档处理流水线——每个步骤上次运行的时间，以及工作是否正常流转或出现积压。

<figure><img src="https://1870485400-files.gitbook.io/~/files/v0/b/gitbook-x-prod.appspot.com/o/spaces%2FlPczlNw8zzYNLfjfispX%2Fuploads%2Fgit-blob-b04449025ed99ca237f89ec0b6921a95c8097223%2Finfrastructure_processing.png?alt=media" alt="带有状态标记的处理任务表"><figcaption><p>你组织各处理步骤的状态</p></figcaption></figure>

| 列        | 说明                                                |
| -------- | ------------------------------------------------- |
| **流程**   | 处理步骤——文档处理、OCR、TR-OCR、条码拆分、条码提取、提取、采购订单匹配。        |
| **上次运行** | 距离该步骤上次运行的时间。将鼠标悬停可查看准确时间戳。\*“从未运行”\*表示尚无文档到达此步骤。 |
| **状态**   | 交通灯样式的标记（见下文）。                                    |

状态标记：

| 标记               | 含义                          |
| ---------------- | --------------------------- |
| **正常**（绿色）       | 最近没有错误，也没有等待处理的任务——此步骤运行正常。 |
| **处理中 (N)**（琥珀色） | 当前有 `N` 份文档正在由此步骤处理。        |
| **错误 (N)**（红色）   | 最近有 `N` 份文档在此步骤处理失败。        |

错误和*处理中*是彼此独立的状态，因此一个步骤可以同时显示这两种标记——即使其他任务正在运行，你仍能看到失败情况。使用右上角的 **刷新** 获取最新数据。

## 计划任务

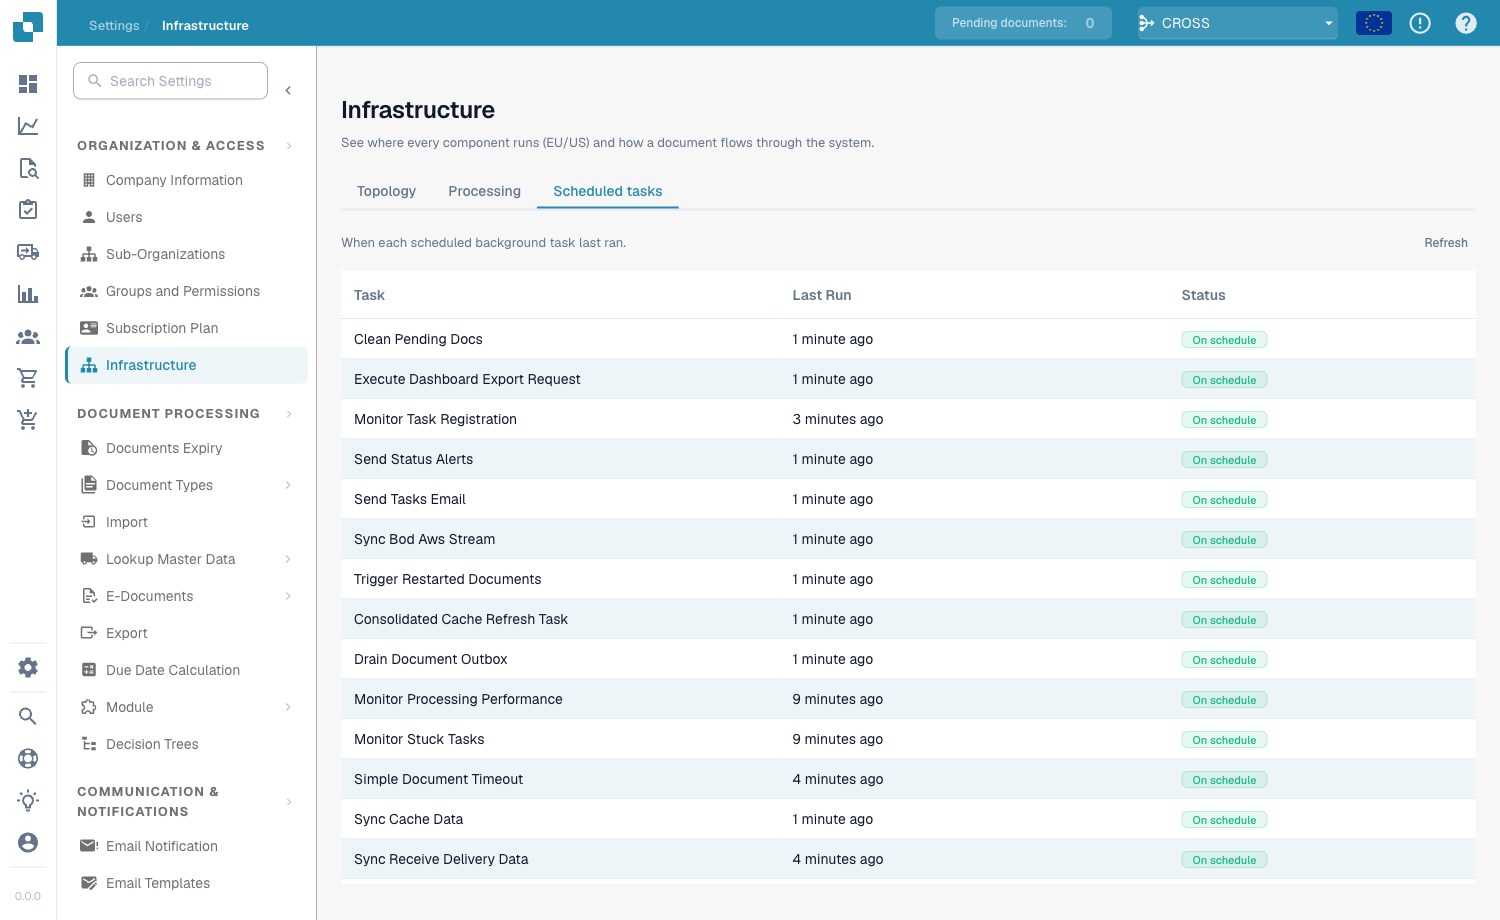
计划任务选项卡列出维持 DocBits 运行的周期性后台作业（缓存刷新、状态提醒、文档超时处理、出站同步等），并确认每项任务是否按时触发。

<figure><img src="https://1870485400-files.gitbook.io/~/files/v0/b/gitbook-x-prod.appspot.com/o/spaces%2FlPczlNw8zzYNLfjfispX%2Fuploads%2Fgit-blob-e3bc37387b0fa2dd217da2a1c62c1a3d9d1de1e8%2Finfrastructure_scheduled.png?alt=media" alt="计划任务表"><figcaption><p>周期性后台作业及其计划状态</p></figcaption></figure>

| 列        | 说明                                              |
| -------- | ----------------------------------------------- |
| **任务**   | 计划作业的名称。                                        |
| **上次运行** | 距离该任务上次运行的时间。将鼠标悬停可查看准确时间戳；\*“从未运行”\*表示该任务尚未触发。 |
| **状态**   | 计划运行状况（见下文）。                                    |

状态值：

| 标记            | 含义                         |
| ------------- | -------------------------- |
| **按计划运行**（绿色） | 任务正按预期的时间间隔运行。             |
| **延迟**（红色）    | 任务未在预期时间运行——建议进行调查或联系支持团队。 |
| **未知**（灰色）    | 无法确定计划状态。                  |

使用 **刷新** 可按需重新检查计划状态。


---

# Agent Instructions
This documentation is published with GitBook. GitBook is the documentation platform designed so that both humans and AI agents can read, navigate, and reason over technical content effectively. Learn more at gitbook.com.

## Querying This Documentation
If you need additional information that is not directly available in this page, you can query the documentation by asking a question.

Perform an HTTP GET request on the following URL with the `ask` and `goal` query parameters:

```
GET https://docs.docbits.com/chinese/guan-li-yu-she-zhi/settings/infrastructure.md?ask=<question>&goal=<user_goal>
```

`ask` is the immediate question: it should be specific, self-contained, and written in natural language.
`goal` is what the user is ultimately trying to achieve, the reason they need the answer. Sharing it helps GitBook give you a better, more relevant answer. A goal is most helpful when it describes the outcome the user wants rather than restating the question. For example, with `ask=how do I create an API token`, a goal like `automate deployments from our CI pipeline` lets GitBook tailor the answer to that use case.

The response will contain a direct answer to the question and relevant excerpts and sources from the documentation.

Use this mechanism when the answer is not explicitly present in the current page, you need clarification or additional context, or you want to retrieve related documentation sections.