> For the complete documentation index, see [llms.txt](https://docs.docbits.com/llms.txt). Markdown versions of documentation pages are available by appending `.md` to page URLs; this page is available as [Markdown](https://docs.docbits.com/administration-and-setup/settings/infrastructure.md).
# Infrastructure
The **Infrastructure** page gives administrators a live, at-a-glance view of where every part of DocBits runs (EU or US), how a document flows through the system, and whether background processing is healthy. It is read-only — nothing here is configured; it answers *"is everything running, and is my data staying in my region?"*
> **Access:** Infrastructure is an admin-only page. Open **Settings → Organization & Access → Infrastructure**.
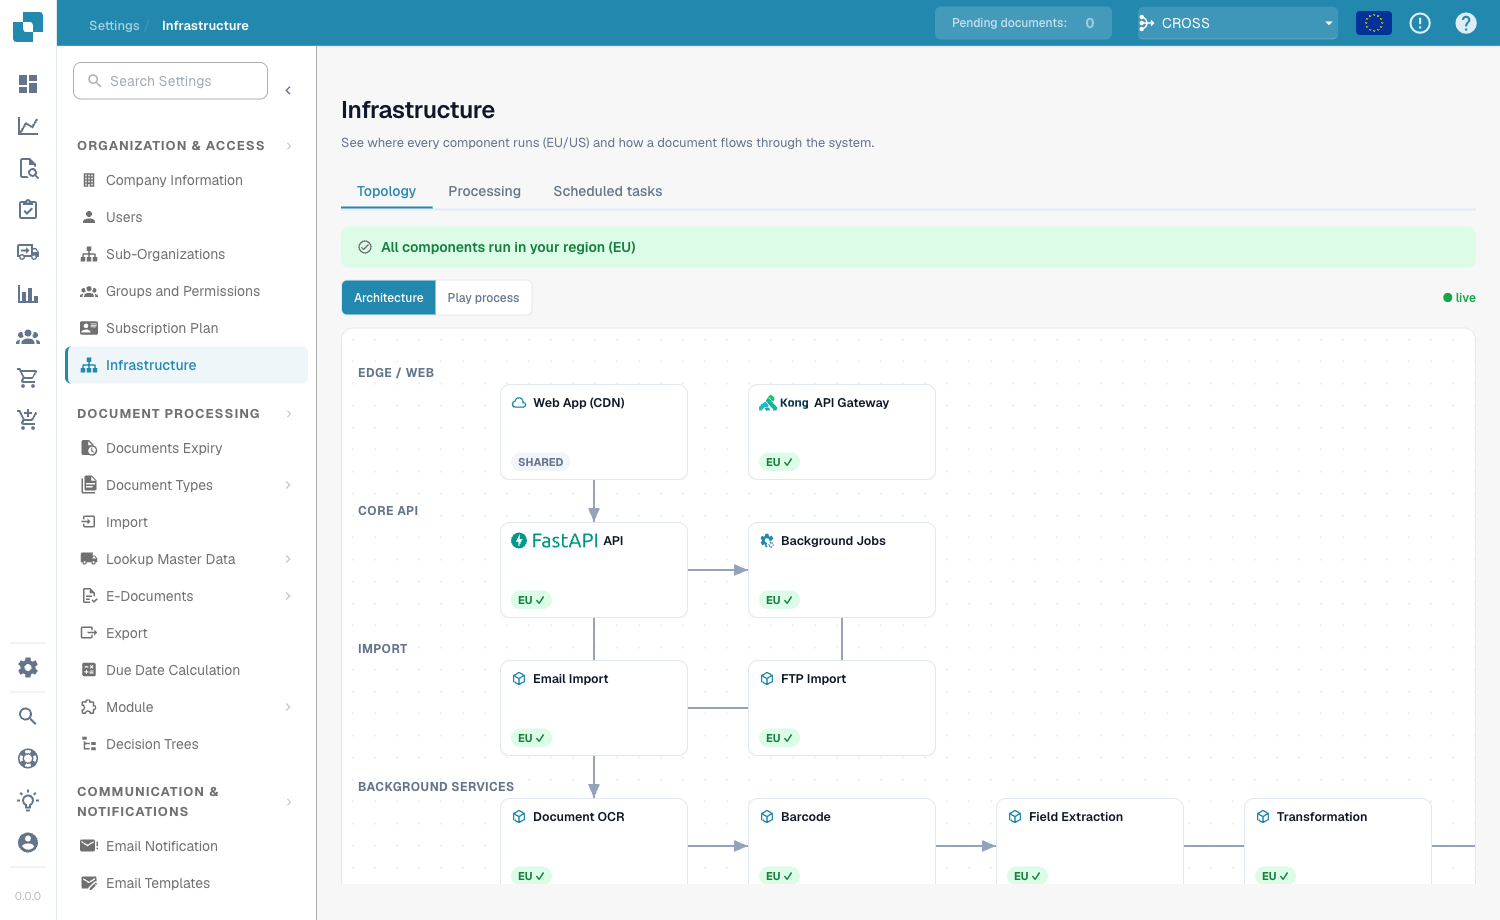
The Infrastructure page, Topology tab
The page is split into three tabs:
| Tab | Answers |
| ------------------- | ----------------------------------------------------------------------------------- |
| **Topology** | Where does each component run, and is it all in my region? |
| **Processing** | Are document-processing steps (OCR, extraction, PO match …) running and up to date? |
| **Scheduled tasks** | Are the recurring background jobs running on schedule? |
## Topology
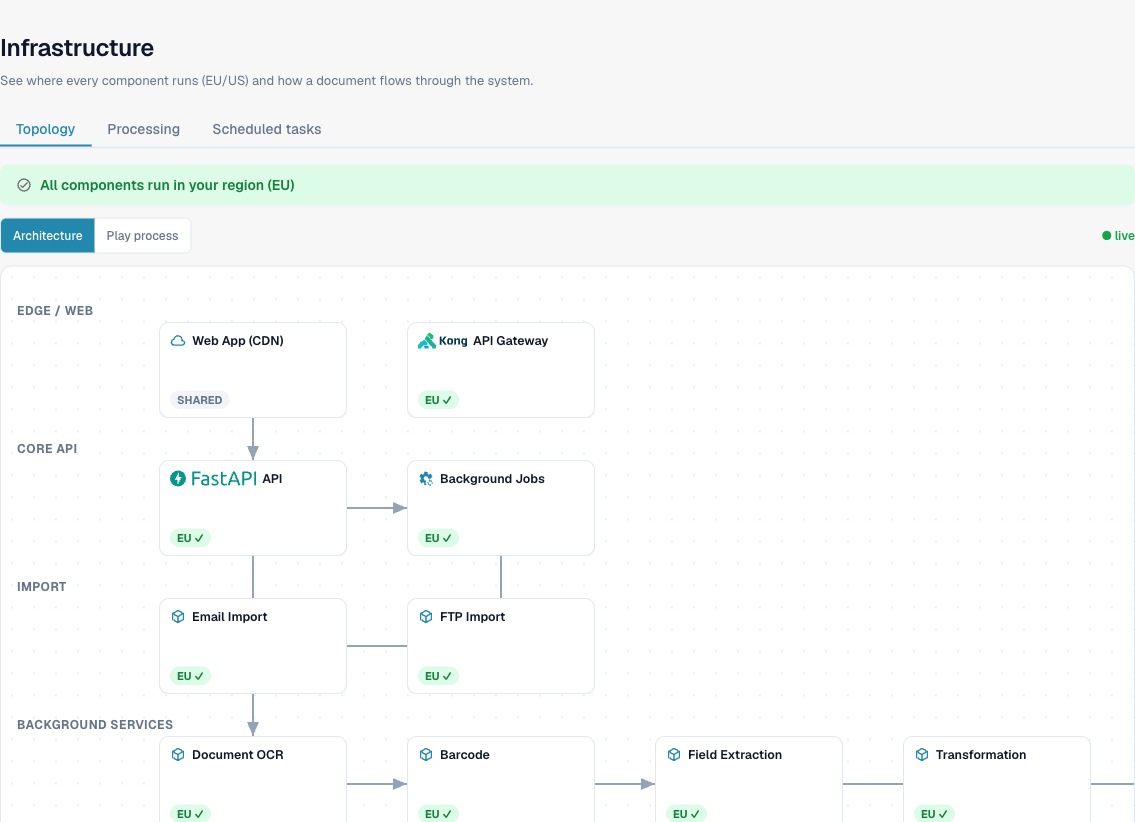
The Topology tab draws the whole DocBits platform as a diagram, grouped into layers — **Edge / Web**, **Core API**, **Import**, **Background Services**, **Datastores** and **Authentication**. Each box is one component (the Web App/CDN, the API Gateway, the OCR worker, the database, and so on).
Every component is tagged with the region it runs in
### Region awareness
Each component carries a region badge so you can confirm your data residency at a glance:
| Badge | Meaning |
| ------------------- | ---------------------------------------------------------------------------------------------------------------------- |
| **EU ✓** / **US ✓** | The component runs in your organization's region. |
| **SHARED** | A global component (e.g. the CDN) with no single region — this is expected and not an issue. |
| **Region mismatch** | The component runs in a *different* region than your organization. It is highlighted so you can raise it with support. |
The banner at the top summarizes the result: **"All components run in your region (EU)"** when everything matches, or a warning if any critical component is cross-region.
### Architecture vs. Play process
Use the toggle above the diagram to switch view:
* **Architecture** — the static map of all components and how they connect.
* **Play process** — animates the journey of a document through the system, step by step, so you can see the order in which components are involved.
The **● live** indicator shows that the health information in the diagram reflects the current state of the system.
### Optional modules
Components that belong to an optional module (Full-Text Search, DocFlow, Auto-Accounting, DocNet, PO Matching) show an **activated** or **deactivated** badge. Clicking a deactivated module takes you straight to the page where you can switch it on — **Settings → Module** for most modules, or **Document Types** for PO Matching (which is enabled per document type).
## Processing
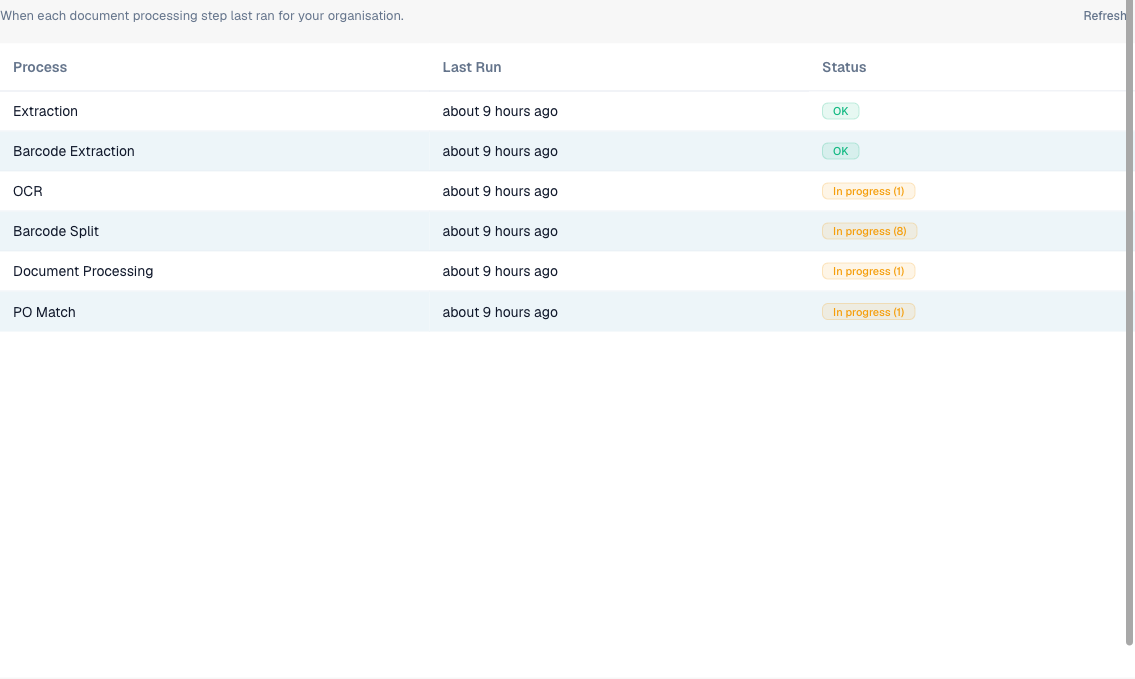
The Processing tab shows the document-processing pipeline for **your organization** — when each step last ran and whether work is flowing or backing up.
Per-step processing status for your organization
| Column | Description |
| ------------ | ------------------------------------------------------------------------------------------------------------------------- |
| **Process** | The processing step — Document Processing, OCR, TR-OCR, Barcode Split, Barcode Extraction, Extraction, PO Match. |
| **Last Run** | How long ago the step last ran. Hover for the exact timestamp. *"Never run"* means no document has reached this step yet. |
| **Status** | A traffic-light badge (see below). |
Status badges:
| Badge | Meaning |
| --------------------------- | ----------------------------------------------------------- |
| **OK** (green) | No recent errors and nothing waiting — the step is healthy. |
| **In progress (N)** (amber) | `N` documents are currently being processed by this step. |
| **Error (N)** (red) | `N` documents recently failed at this step. |
Errors and *in progress* are independent signals, so a step can show both badges at once — you still see a failure even while other work is running. Use **Refresh** (top-right) to pull the latest numbers.
## Scheduled tasks
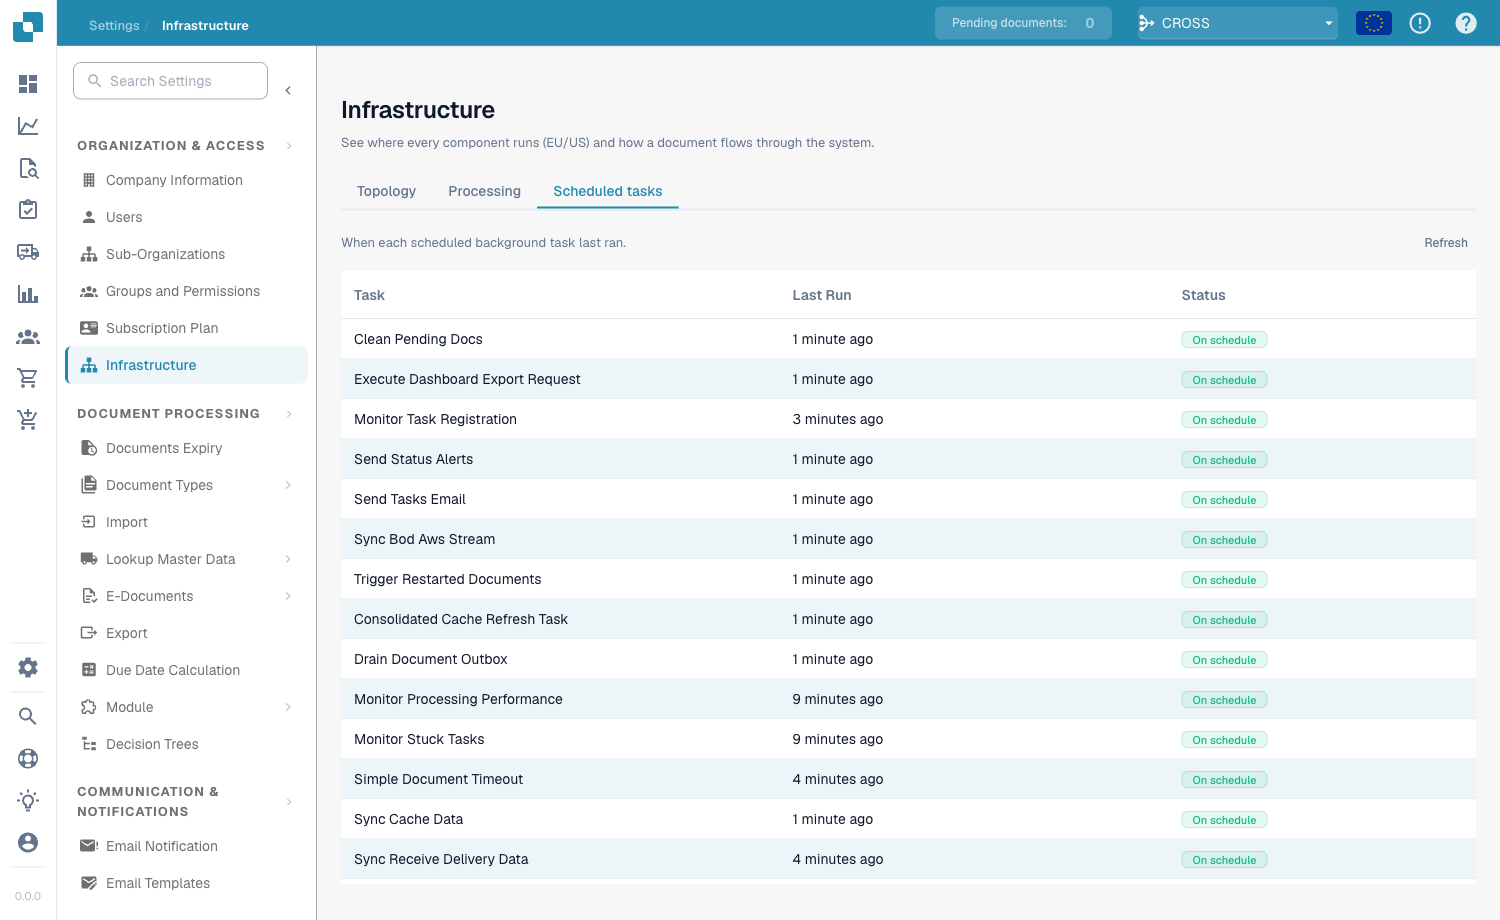
The Scheduled tasks tab lists the recurring background jobs that keep DocBits running (cache refreshes, status alerts, document timeouts, outbound syncs, and more) and confirms each one is firing on time.
Recurring background jobs and their schedule status
| Column | Description |
| ------------ | -------------------------------------------------------------------------------------------------- |
| **Task** | The name of the scheduled job. |
| **Last Run** | How long ago it last ran. Hover for the exact timestamp; *"Never run"* means it has not fired yet. |
| **Status** | Schedule health (see below). |
Status values:
| Badge | Meaning |
| ----------------------- | --------------------------------------------------------------------------------- |
| **On schedule** (green) | The task is running at its expected interval. |
| **Delayed** (red) | The task has not run when expected — worth investigating or raising with support. |
| **Unknown** (grey) | Schedule status could not be determined. |
Use **Refresh** to re-check the schedule status on demand.
---
# Agent Instructions
This documentation is published with GitBook. GitBook is the documentation platform designed so that both humans and AI agents can read, navigate, and reason over technical content effectively. Learn more at gitbook.com.
## Querying This Documentation
If you need additional information that is not directly available in this page, you can query the documentation dynamically by asking a question.
Perform an HTTP GET request on the current page URL with the `ask` query parameter, and the optional `goal` query parameter:
```
GET https://docs.docbits.com/administration-and-setup/settings/infrastructure.md?ask=&goal=
```
`ask` is the immediate question: it should be specific, self-contained, and written in natural language.
`goal` is optional and describes the broader end goal you are ultimately trying to accomplish on behalf of the user. GitBook uses it to tailor the answer towards what is most useful for that goal.
The response will contain a direct answer to the question and relevant excerpts and sources from the documentation.
Use this mechanism when the answer is not explicitly present in the current page, you need clarification or additional context, or you want to retrieve related documentation sections.