> For the complete documentation index, see [llms.txt](https://docs.docbits.com/llms.txt). Markdown versions of documentation pages are available by appending `.md` to page URLs; this page is available as [Markdown](https://docs.docbits.com/administration-and-setup/settings/global-settings/groups-users-and-permissions/users/login-analytics.md).
# Login Analytics
**Login Analytics** gives administrators a read-only, organization-wide view of *when* and *how often* people sign in to DocBits. It answers questions like "are logins trending up?", "how many distinct users were active this month?" and "when do the usage peaks happen?" — without exposing any individual user's credentials or personal data.
> **Access:** Open **Settings → Organization & Access → Users** and click the **Login Analytics** button in the top-right corner (`/settings/login-analytics`).
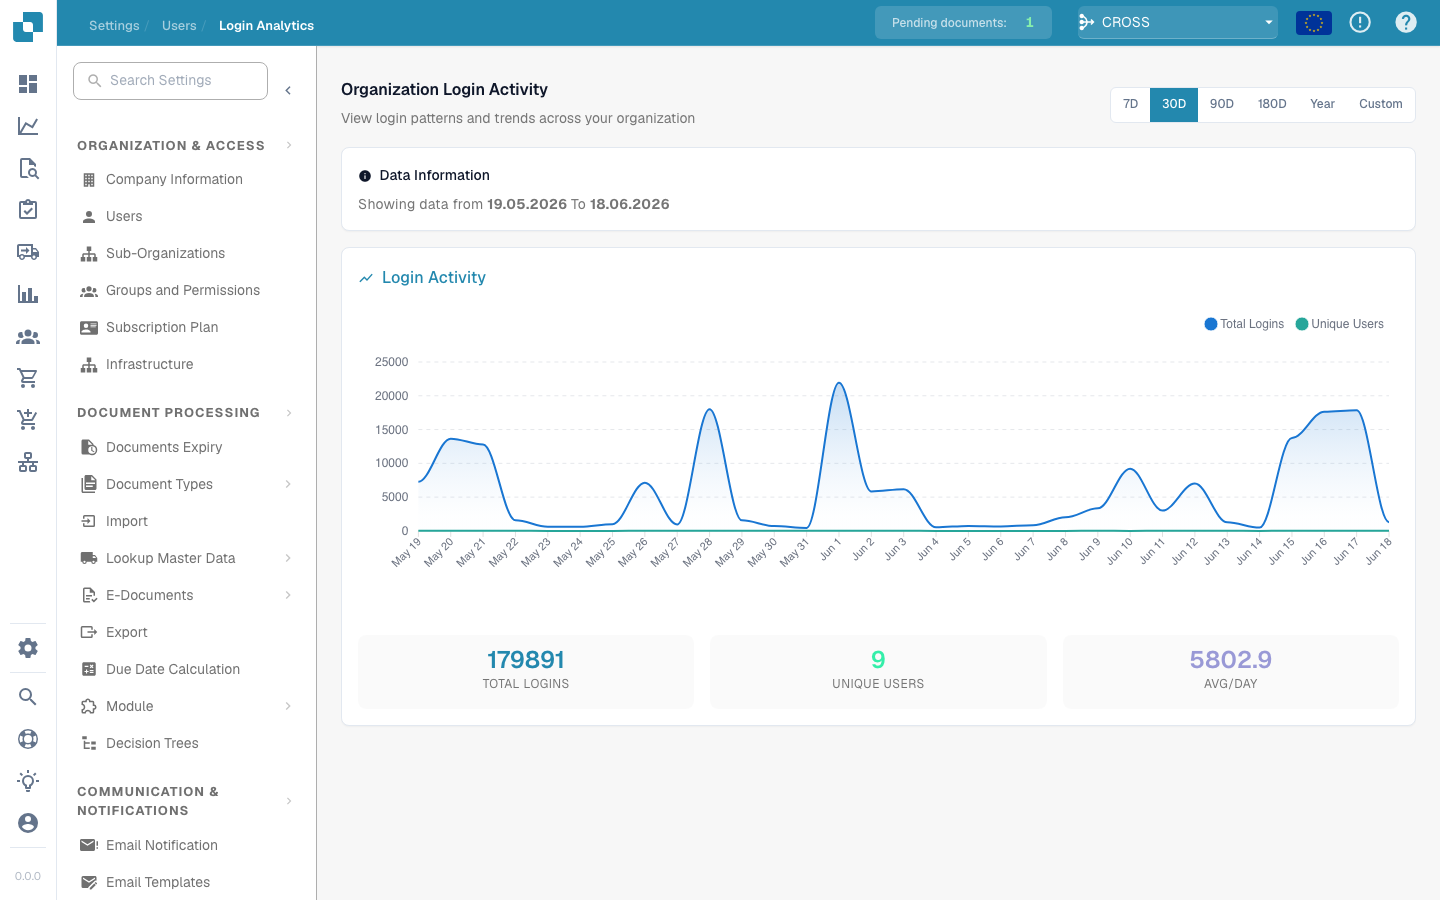
Organization login activity over the selected period
## Time range
Pick the period to analyze with the selector in the top-right: **7D**, **30D**, **90D**, **180D**, **Year**, or **Custom** for a free date range. Everything on the page — the chart and the summary cards — recalculates for the period you choose.
The **Data Information** banner restates the exact window in view (e.g. *Showing data from 19.05.2026 to 18.06.2026*), so it is always clear which dates the numbers cover.
## Login activity chart
The chart plots two series over the selected period:
| Series | Meaning |
| ---------------- | ----------------------------------------------------------------------------- |
| **Total Logins** | The number of sign-ins per day, including repeated logins by the same person. |
| **Unique Users** | How many *distinct* users signed in that day. |
Hover over any point to read the exact value for that day. Peaks show your busiest days; a flat **Unique Users** line under a spiky **Total Logins** line means a few people logged in many times.
## Summary cards
Below the chart, three cards summarize the whole selected period:
| Card | Meaning |
| ---------------- | ------------------------------------------------- |
| **Total Logins** | All sign-ins across the period. |
| **Unique Users** | Distinct users who signed in at least once. |
| **Avg/Day** | Average number of logins per day over the period. |
## Privacy
Login Analytics reports **aggregate** numbers only — counts and trends for the organization as a whole. It does not list individual users, email addresses, or IP addresses. To see or edit a specific person's account, use the [Users](/administration-and-setup/settings/global-settings/groups-users-and-permissions/users.md) page instead.
---
# Agent Instructions
This documentation is published with GitBook. GitBook is the documentation platform designed so that both humans and AI agents can read, navigate, and reason over technical content effectively. Learn more at gitbook.com.
## Querying This Documentation
If you need additional information that is not directly available in this page, you can query the documentation dynamically by asking a question.
Perform an HTTP GET request on the current page URL with the `ask` query parameter, and the optional `goal` query parameter:
```
GET https://docs.docbits.com/administration-and-setup/settings/global-settings/groups-users-and-permissions/users/login-analytics.md?ask=&goal=
```
`ask` is the immediate question: it should be specific, self-contained, and written in natural language.
`goal` is optional and describes the broader end goal you are ultimately trying to accomplish on behalf of the user. GitBook uses it to tailor the answer towards what is most useful for that goal.
The response will contain a direct answer to the question and relevant excerpts and sources from the documentation.
Use this mechanism when the answer is not explicitly present in the current page, you need clarification or additional context, or you want to retrieve related documentation sections.